Designing an effective questionnaire requires more than just using the right words. While it is essential to ask the right questions, it is also crucial to avoid making design mistakes that could bias the results. Developing survey research takes time, knowledge, and skills. Anyone who writes survey questionnaires wants to be rewarded with high response rates. And you might ask, how does one reduce the dropout rates?
For over 40 years, we have helped hundreds of clients worldwide manage their surveys. Based on our experience, factors such as visual design and usability can increase the success of every survey research.
Write clearly and simply
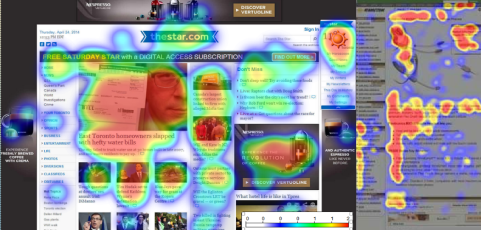
In our eye-tracking studies using heatmap tools, we found out most users don’t read the entire page in a word-by-word manner; they scan through the web pages. We know web pages and surveys are not the same, but users might behave the same way when reading lengthy text questions.
Hence, writing clearly and choosing the right words is important when writing questionnaires. Knowing that users scan through the heavy text pages, you should highlight or bold action words and place important information such as instructions at the top of the page separated from the questions to obtain the desired information.
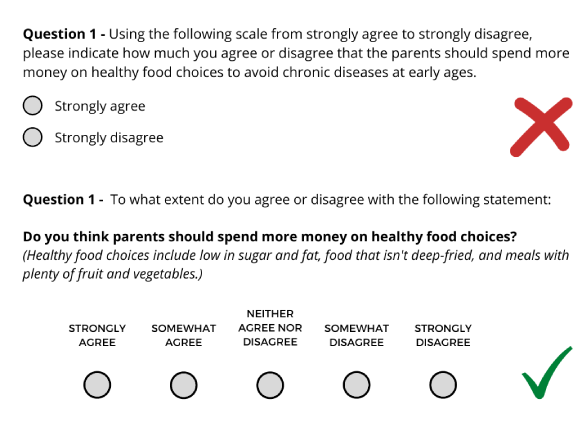
You should also avoid using leading questions, these types of questions skew people towards certain answers. Poorly crafted survey questionnaires result in unreliable results.
Use visual clues
Clear fonts, headlines, symbols, numeric, and text boxes can improve readability and increase participants’ engagement
- Highlight, bold, or capitalized survey instructions
- Use the right buttons: Radio buttons are used to ‘select one choice’, and checkboxes are used when ‘selecting all’
- Use radio buttons rather than drop-down menus to make the choices visible for users
- Add arrows next to the Back and Next buttons
- Break up the questions into categories and pages that don’t require scrolling
- Be clear about the survey duration on the first page
- Use progress bar so users can see how they are doing

Avoid visual clutter
The average human attention span is 8 seconds. When users receive a large amount of information that surpasses their comprehension ability, it affects their performance. They may take longer to understand, get overwhelmed and quit. To gain the user’s attention, you need to eliminate redundant links, irrelevant images, and elements. Clear and meaningful images can increase user engagement.
Survey design can improve the response rate and accuracy of the data. When designing research, it’s important to keep in mind a simple task that can generate more accurate results. By simplifying the layout of your survey, users can focus more on the questions and will get you to higher completion rates. If you are unsure how to improve your survey design, contact us; we’ll help you pick the best tools that suit your needs.
You might like to read these:
. How To Clean A Marketing Research Questionnaire Dataset
. Top 5 tips for writing a questionnaire people will want to answer
. What sample size do I need for my research questionnaire?


