The difference between correlation and causation seems fairly straightforward. Correlation means there is some kind of relationship between the variables but it’s impossible to determine if one is the root cause of the other. Causation means there is a predictable relationship between variables such that a change in one directly causes a specific and measurable change to the other.
But it’s not that simple.
Let’s start with a few fun examples showing how ridiculous it is to assume that a correlation is the same things as causation. 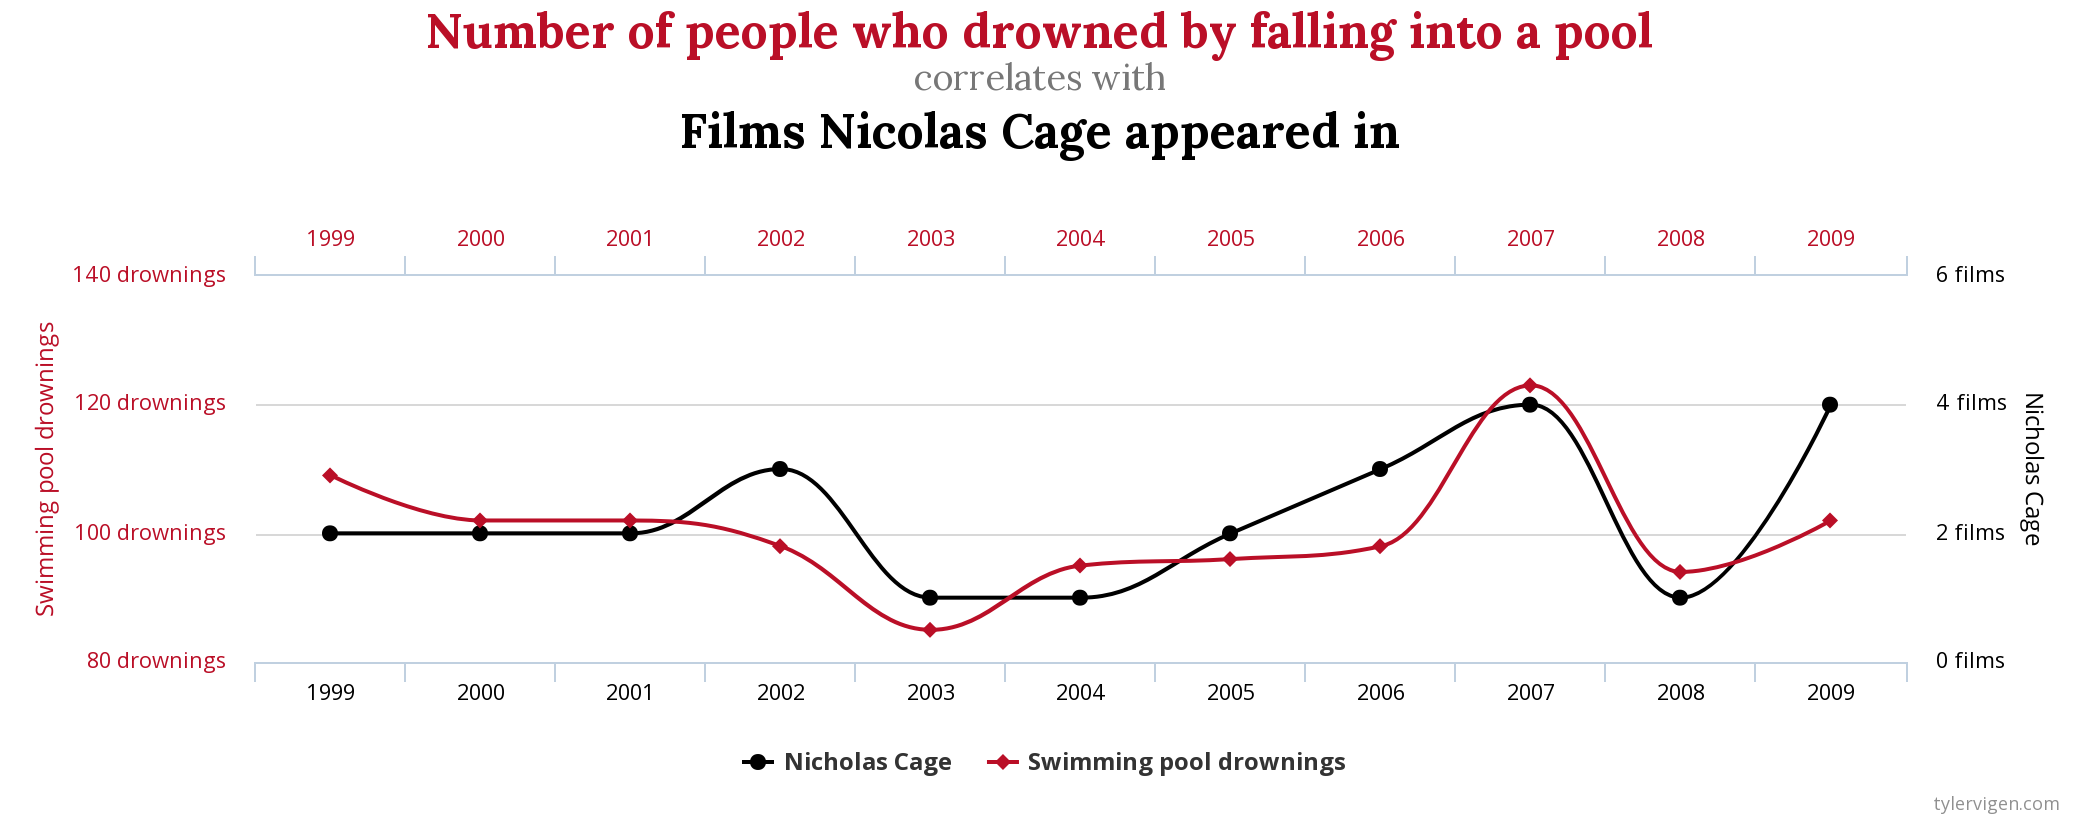 Tyler Vigen has created a hilarious website called Spurious Correlations that illustrates very high correlations between obviously unrelated variables such as the number of films Nicolas Cage appeared in and the number of people who drowned by falling into a pool (r=0.66) or per capita cheese consumption and the number of people who died by becoming tangled in their bedsheets (r=0.95).
 And if those correlations aren’t ridiculous enough, you can also refer to datasaurs on GitHub which automatically produces correlations between various types of death and the shape of dinosaurs.
Thanks to random chance and coincidence, correlations exist between trillions of completely unrelated variables. And some of those relationships seem to be causal.
In reality, it can be difficult to determine whether a relationship between variables is causal or correlational. For instance, there is absolutely a relationship between education and income – people who have greater income often also have greater educational achievement. Does that mean that if you give someone a lot of money, they will automatically be more successful in their education (causal)? Or, instead does it mean that people who have a lot of money can use their spare time studying instead of working multiple jobs and being the primary caregiver to minors and elders in their family (correlational)?
Marketers create new products or improve existing products in order to purchase. Unfortunately, it’s impossible to predict the eventual effectiveness of a feature, package, product, or service unless you can identify the root cause of its potential success or failure. It’s important to understand whether people are really buying a new product because it’s a better product (causal) or because they have no choice since it’s the only one they can afford (correlational)? Are people shopping at your store because it’s a better store (causal) or because it’s the only one in walking distance (correlational)? Knowing the answers to these questions means that a successful result can be generalized to other people and locations, and a failed result will not be launched more widely.
One of the best ways to identify which type of relationship you’re working with is to conduct an experiment, typically called a Test Control or A/B experiment. In its purest form, and often unachievable, the researcher creates two scenarios in which everything is identical except for one thing. With a Test/Control design, the Control group experiences the standard, traditional Process/Product while the Test group experiences the new or different Process/Product. With the A/B nomenclature, there’s not necessarily a ‘traditional’ or ‘new’ process, but rather a Process/Product A and a Process/Product B.
Let’s work through a simple example of an experiment. Imagine we have created a new product package and we want to know if consumers would buy it over the original package. Thus, the Control situation is the consideration of the original package and the Test group is the consideration of the new package.
Experiment #1: The basic process is to find customers, show them the original package and the new package, and then have them rate which package they would buy.
Outcome: Customers indicate they would buy the original package.
Considerations: Unfortunately, this method failed to create one single difference between the test and control groups. There were actually two major differences between the groups. Not only did the Control situation included package A and the Test situation included package B, the Control situation included a package people were familiar with while the Test situation included a package people were not familiar with.
Correlation or causation? What caused the higher purchase score – higher familiarity or the new (better, more effective) packaging? Or, even worse, were the higher scores unconsciously and inadvertently generated because the original package was near the window with a view of a beautiful garden, or because the researcher was standing next to it, or because it was next to the delicious snacks? All of these extraneous variables (and so many more) could have interfered with the research to create a spurious correlation that was in no way due to the packaging.
Experiment #2: The basic process is to find people who are unfamiliar with the brand, show them the original package and the new package, and then have them rate which package they would buy.
Outcome: People indicate they would buy the new package.
Considerations: There was one major difference between the test and control groups. The Control situation included package A and the Test situation included package B.
Conclusion: We now know that the new package caused higher purchase rates.
Caveat: But we have a new problem now! We know that people would prefer to buy the new package, but what if customers don’t buy the new package because they prefer the original package? Should the new package be used in order to draw in new consumers, or should the original package be used in order to retain existing customers? It’s not a simple decision!
 With a hypothesis in mind and potential outcomes identified, it’s important to replicate the study to ensure that coincidence and random chance didn’t interfere. Conduct the same study with a different target group such as competitive brand users, category buyers, heavy users, or occasional users.
Alternatively, try a new methodology. If the first study was conducted using a questionnaire, try a mall intercept or a focus group for the second study. If the conclusions remain the same after the second study, you can be more confident that you’ve discovered a causal effect. It’s time to make a formal decision!
If you’d like help designing an experiment to determine the effectiveness of your new packaging or product, please get in touch with us! We’d love to discuss the advantages and disadvantages of using IHUTs, mall interceptions, focus groups, IDIs, questionnaires and more as part of your experimental processes.


